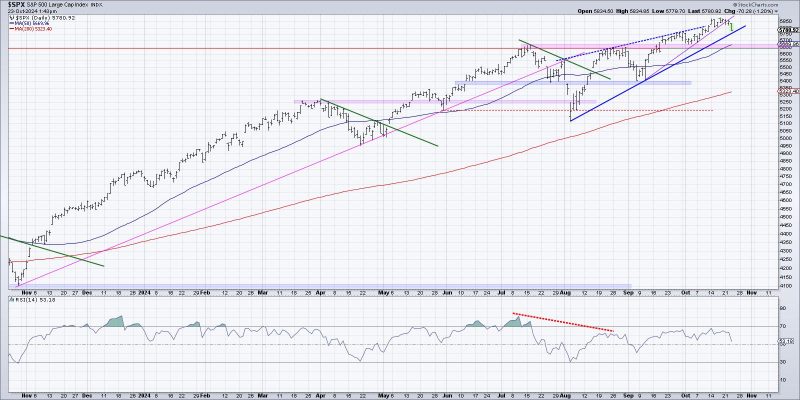
Three Ways to Visualize the Start of a Potential Distribution Phase
1. Volume Analysis:
One of the key indicators that can signal the start of a potential distribution phase in the stock market is volume analysis. Volume refers to the number of shares traded in a given period. In the context of distribution, an increase in volume can indicate that institutional investors or smart money may be selling off their positions. By analyzing volume patterns, traders can gain insight into whether there is strong selling pressure building up, which could lead to a distribution phase.
Volume analysis can be done by looking at the volume bars on a price chart or by using technical indicators such as the volume oscillator. A spike in volume accompanied by price weakness could be a sign that distribution is beginning to take place. It is important to compare current volume levels to historical averages to determine if there is a significant deviation that may signal a shift in market sentiment.
2. Bearish Divergence:
Another way to visualize the start of a potential distribution phase is through the observation of bearish divergences on technical indicators. Bearish divergences occur when the price of an asset is making higher highs, but the accompanying technical indicator is making lower highs. This discrepancy can indicate that buying pressure is weakening and that a distribution phase may be imminent.
Common technical indicators that traders use to identify bearish divergences include the Relative Strength Index (RSI), the Moving Average Convergence Divergence (MACD), and the Stochastic Oscillator. By paying attention to the signals provided by these indicators, traders can gain valuable insights into the underlying strength or weakness in the market.
3. Price Action Confirmation:
Lastly, one of the most straightforward ways to visualize the start of a potential distribution phase is through price action confirmation. In a distribution phase, prices tend to consolidate and move sideways, indicating a lack of strong buying interest. Traders can look for price patterns such as lower highs and lower lows, along with decreasing volatility, as potential confirmation of a distribution phase.
Chart patterns such as head and shoulders, double tops, and descending triangles can also provide clues that the market is transitioning from an accumulation phase to a distribution phase. By combining price action analysis with other technical indicators, traders can increase their confidence in identifying the early signs of distribution and adjust their trading strategies accordingly.
In conclusion, by utilizing volume analysis, observing bearish divergences, and confirming price action signals, traders can effectively visualize the start of a potential distribution phase in the stock market. Recognizing these early warning signs can help traders make informed decisions and adapt their trading strategies to navigate volatile market conditions successfully.


