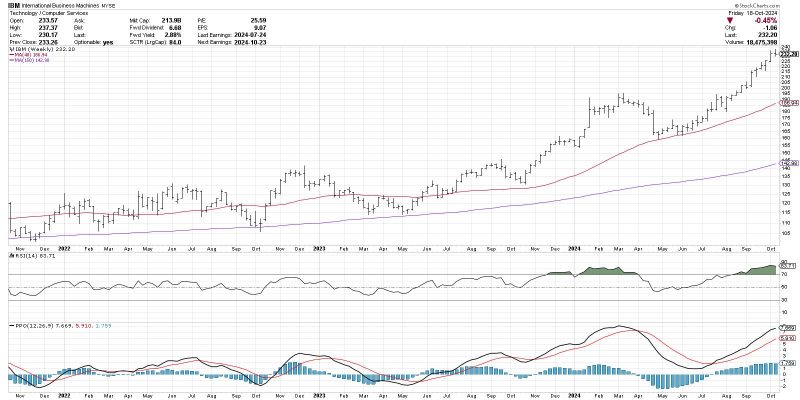
In the world of financial markets and trading, the ability to anticipate and make well-informed decisions about trend changes is crucial for success. Many traders, both novice and experienced, employ various technical analysis tools to help them gain insights into market direction and potential changes in trends. One such tool that has gained popularity among traders is the MACD histogram.
The MACD (Moving Average Convergence Divergence) histogram is a momentum indicator that helps traders identify potential trend changes and possible entry and exit points in the market. It is derived from the MACD line, which is calculated by subtracting the 26-period Exponential Moving Average (EMA) from the 12-period EMA. The resulting MACD line is then plotted alongside the signal line, which is typically a 9-period EMA of the MACD line.
The MACD histogram, on the other hand, represents the difference between the MACD line and the signal line. When the MACD line crosses above the signal line, the histogram values move into positive territory, indicating a possible bullish trend. Conversely, when the MACD line crosses below the signal line, the histogram values move into negative territory, signaling a potential bearish trend.
One of the key features of the MACD histogram is its ability to provide early signals of trend changes, giving traders a valuable edge in their decision-making process. By analyzing the direction and slope of the histogram bars, traders can gauge the strength and momentum of a trend and identify potential entry or exit points.
Moreover, the MACD histogram can also be used in conjunction with other technical indicators and chart patterns to confirm signals and enhance the overall reliability of trading decisions. For example, a trader may look for convergence or divergence between the histogram and price action to validate a potential trend reversal.
It is important to note that like any technical analysis tool, the MACD histogram is not foolproof and should be used in conjunction with other forms of analysis and risk management strategies. Traders should also be aware of the limitations of the indicator, such as false signals during choppy or ranging markets, and adapt their trading approach accordingly.
In conclusion, the MACD histogram holds the potential to be a valuable tool for traders looking to anticipate trend changes in the financial markets. Its simplicity and effectiveness in providing early signals of trend reversals make it a popular choice among traders seeking to gain a competitive edge. By understanding how to interpret and use the MACD histogram effectively, traders can improve their decision-making process and increase their chances of success in the dynamic world of trading.


