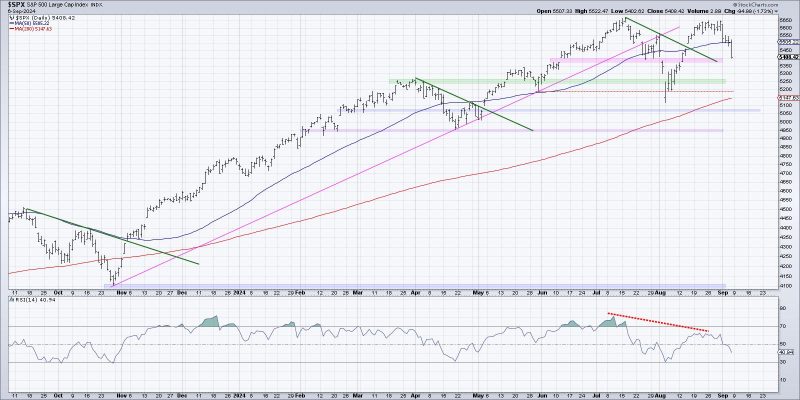
Three Charts Screaming Market Top: What Investors Need to Know
Chart 1: The Shiller PE Ratio
The Shiller PE ratio, also known as the cyclically adjusted price-to-earnings ratio, has long been a favorite indicator among investors and analysts to assess market valuation. Developed by Nobel laureate Robert Shiller, this ratio compares the current stock price to the average inflation-adjusted earnings of the past 10 years. A high Shiller PE ratio suggests that the market may be overvalued, indicating a potential market top.
In the past, peaks in the Shiller PE ratio have often corresponded with market downturns and recessions. Currently, the Shiller PE ratio is significantly above its historical average, indicating that stocks may be overpriced relative to earnings. This could signal that the market is approaching a top and investors should exercise caution.
Chart 2: Margin Debt Levels
Margin debt, or borrowed money used by investors to purchase securities, is another important indicator to watch for signs of a market top. When investors are overly optimistic about the market, they tend to borrow more to leverage their investments, driving margin debt levels higher. However, excessive margin debt can amplify losses in a market downturn, leading to a rapid sell-off as investors are forced to liquidate positions to cover their debts.
Currently, margin debt levels are at historical highs, suggesting that investors may be heavily leveraged and vulnerable to a market downturn. High margin debt levels indicate that many investors are operating with high levels of risk, and a market correction could trigger widespread selling as investors rush to deleverage their positions.
Chart 3: Trendlines and Technical Analysis
Technical analysis involves studying historical price and volume data to identify patterns and trends in the market. Trendlines are a key tool used in technical analysis to visualize the direction of price movements over time. When stock prices consistently follow an upward trendline, it indicates a bullish market sentiment. Conversely, a break below a trendline could signal a reversal in the market trend.
Currently, many stock indices are hovering near or slightly above their long-term trendlines, suggesting that the market may be reaching a critical juncture. If stocks fail to break through these resistance levels and instead start to decline, it could be a warning sign that a market top is near.
In conclusion, these three charts provide valuable insights into the current state of the market and the potential for a market top. The Shiller PE ratio, margin debt levels, and trendlines all point to signs of overvaluation and heightened risk in the market. Investors should closely monitor these indicators and exercise caution to protect their portfolios in anticipation of a possible market downturn. By staying informed and making prudent investment decisions, investors can navigate volatile market conditions and position themselves for long-term success.


