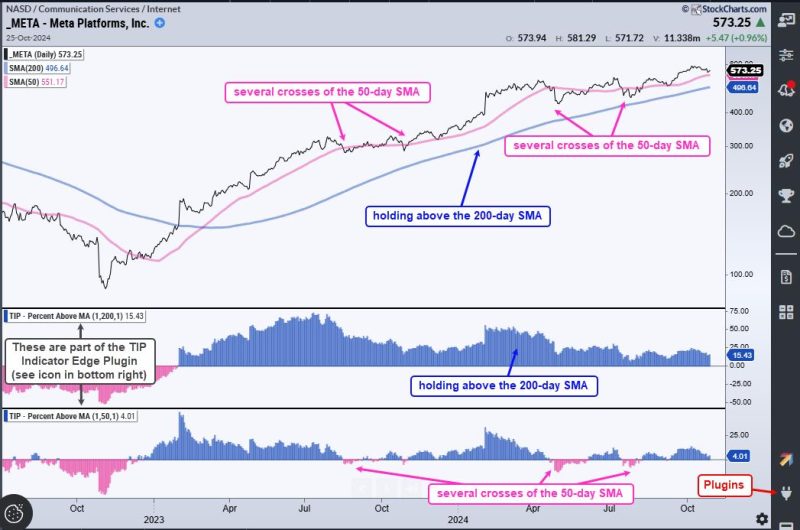
In trading and investing, having an edge over the market is crucial for success. An edge is what allows you to consistently outperform the market and generate profits. While there are numerous indicators and strategies that traders use to gain an edge, two key indicators that can significantly improve your trading performance are the Relative Strength Index (RSI) and Moving Average Convergence Divergence (MACD).
The Relative Strength Index (RSI) is a momentum oscillator that measures the speed and change of price movements. It ranges from 0 to 100 and is typically used to identify overbought or oversold conditions in the market. A reading above 70 is considered overbought, indicating that the asset may be due for a reversal, while a reading below 30 is considered oversold, suggesting that the asset may be undervalued.
By using the RSI indicator, traders can identify potential trend reversals and take advantage of market inefficiencies. For example, when the RSI crosses above 70, it can signal a potential sell signal, indicating that the asset may be overvalued and due for a correction. Conversely, when the RSI crosses below 30, it can signal a potential buy signal, suggesting that the asset may be oversold and due for a bounce back.
Moving Average Convergence Divergence (MACD) is another popular indicator that helps traders identify trend direction and momentum. It consists of two lines – the MACD line and the signal line – which are used to generate buy and sell signals. When the MACD line crosses above the signal line, it generates a bullish signal, indicating that the asset may be trending upwards. Conversely, when the MACD line crosses below the signal line, it generates a bearish signal, suggesting that the asset may be trending downwards.
By using the MACD indicator, traders can confirm the strength of a trend and make informed trading decisions. For example, if the MACD line is diverging from the signal line, it indicates a strong trend, making it a good opportunity to enter a trade. On the other hand, if the MACD line is converging towards the signal line, it suggests a weakening trend and may be a signal to exit a trade.
In conclusion, incorporating the Relative Strength Index (RSI) and Moving Average Convergence Divergence (MACD) indicators into your trading strategy can significantly improve your edge in the market. By using these indicators to identify potential trend reversals, overbought or oversold conditions, and trend strength, you can make more informed trading decisions and increase your chances of success. Remember to combine these indicators with other tools and strategies to create a well-rounded trading approach and always practice risk management to protect your capital.


